Event Sustainability Metrics Worth Tracking in 2027
6 minute read
Table of Contents
WHY TRACK EVENT SUSTAINABILITY METRICS?
HOW CAN YOU BUILD A BASELINE OF EVENT SUSTAINABILITY METRICS?
1. How to calculate waste diversion rate
2. How to measure printed materials reduction
3. How to track digital signage adoption
4. How to measure local sourcing share
TALK WITH AN EVENT TECHNOLOGY PARTNER ABOUT EVENT SUSTAINABILITY OPTIONS
FREQUENTLY ASKED QUESTIONS ABOUT EVENT SUSTAINABILITY AND SUSTAINABILITY METRICS
What are the most important event sustainability metrics?
How can event technology reduce event waste?
What if we never tracked event sustainability metrics before this year?
For event planners, the concept of “going green” has changed. Beyond making more sustainable choices, they’re now being asked to provide hard numbers that those choices made a difference. It’s a shift from saying, “We made a greener choice,” to being expected to add, “And here’s how it specifically benefited our organization and the individuals and communities we serve.”
This takes real work, but it’s manageable. Developing and monitoring event sustainability metrics requires upfront time. You’ll need to choose which key performance indicators (KPIs) are worth tracking and put processes in place to collect the data.
WHY TRACK EVENT SUSTAINABILITY METRICS?
Before jumping into a list of sustainability metrics to consider tracking, let’s address the broader question of why it’s important to put event sustainability front and center for 2027 and beyond.
Many companies now publish environmental, social, and governance (ESG) reports. Nearly one-quarter of Fortune 500 companies are getting their reports verified by third-party sources. Here’s why: Those reports are often reviewed closely by stakeholders including employees, customers, and shareholders. Including measurable event sustainability data in an ESG report can provide evidence of a company’s commitment to sustainability, right down to the internal and external events it holds.
Another reason to build sustainability measurement into every event is that it creates an environmentally focused mindset among the planning team. When the team knows sustainability is being measured, decisions change early. Print quantities get questioned, signage plans shift to digital, and someone asks the venue for waste-hauler weight tickets before move-in, not after teardown. Being strategic and sustainably minded at the beginning of the planning process can minimize frustrating and expensive last-minute fixes.
Finally, tracking sustainability metrics gives event planners a way to differentiate their conferences, trade shows, conventions, and meetings. For instance, using concrete metrics, they can illustrate the numerous ways that they’ve standardized their practices to align with the EIC Sustainable Event Standards. That can influence whether sustainability-minded attendees, exhibitors, and presenters choose your event.
HOW CAN YOU BUILD A BASELINE OF EVENT SUSTAINABILITY METRICS?
Planners don’t need to track every possible metric right away. Start with a few baseline metrics, like those below, and add more over time.
1. How to calculate waste diversion rate
Waste will always be generated at an event. Cardboard. Paper. Pamphlets. Even food. But it’s possible to measure both how much waste an event creates and how much of it is recycled, composted, or donated.
To calculate waste diversion rate, add up the total waste created at an event (usually measured in pounds). Next, divide the pounds of waste diverted from landfill (recycled, composted, or donated) by that total and multiply by 100. The result is the event’s waste diversion rate, which becomes the baseline for future events.
Formula: Waste diversion rate (%) = pounds of waste diverted ÷ total pounds of waste × 100
2. How to measure printed materials reduction
Start by reviewing print orders from past events, including programs, maps, handouts, and signage. Then identify which items an event app or digital signage could replace.
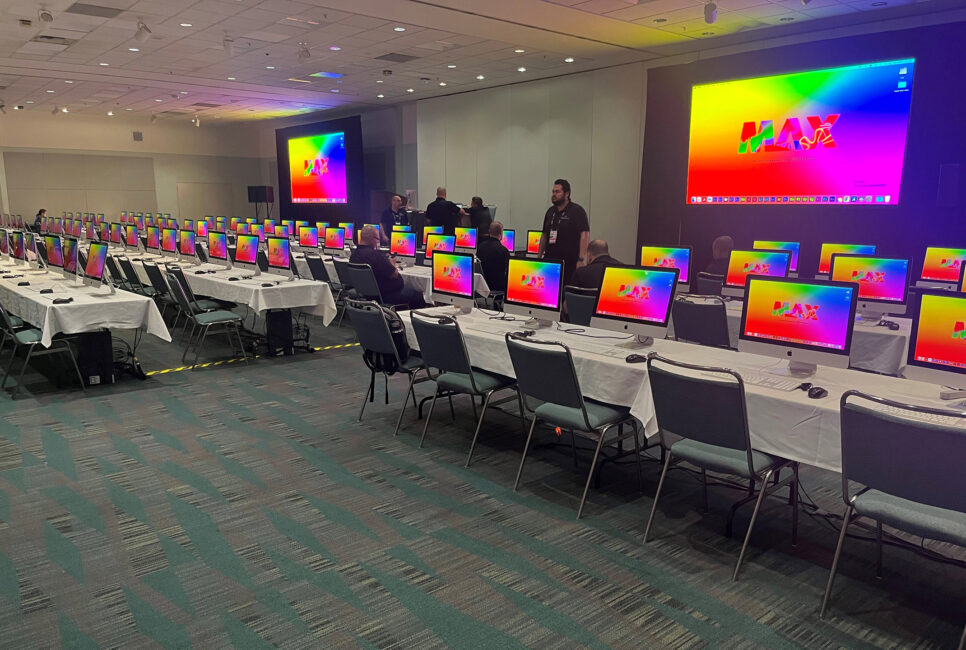
For example, an event app could eliminate the need for all (or most) physical paper brochures and handouts, providing both event sustainability and cost savings. When registration, the event app, and onsite badge printing are connected, attendee data flows from online registration straight to the kiosk. Badges print on demand and only for attendees who check in, so there’s no stack of unclaimed badges at the end of the show.
There are two ways to measure this. First, estimate the paper saved by comparing your 2027 event’s print volume with a previous year’s. Second, calculate the reduction in carbon footprint that came from printing fewer materials. Either metric would be a logical way to showcase the impact behind using less paper.
3. How to track digital signage adoption
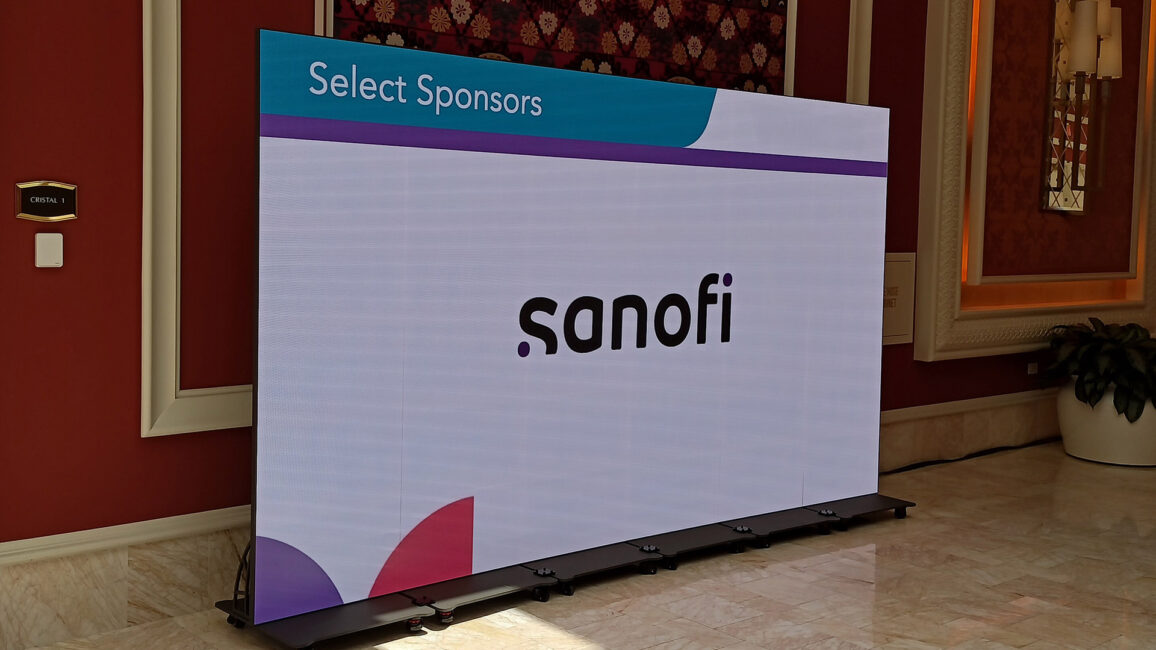
Many planners are replacing conventional cardboard, paper, or plastic banners and signs with digital signage. Digital LED signs can take the place of banners, billboards, and even traditional step-and-repeat backgrounds. Because content can be updated in seconds, digital signage eliminates the reprinting that comes with agenda changes, sponsor updates, and room swaps. Throughout the show, the same screen can shift from welcome messages to agenda updates to call-to-action QR codes.
To track the return on investment (ROI) of digital signage, event planners can look at the real and hidden costs of any paper-based signs they’re replacing. Cost is part of the picture, but not all of it. Compare the number of printed signs avoided, the reprints eliminated by last-minute changes, and the reduced material going to the landfill.
How to measure it: Count the printed signs, banners, and directional pieces replaced by digital displays, then compare that number with your last event’s signage order.
4. How to measure local sourcing share
Hauling items to and from an event can be hard on the environment and on an event budget. Therefore, looking for local vendors closer to an event venue can be another way to produce a sustainability metric.
For example, if an event needs printed materials, using a local printer cuts transportation and the emissions that come with it.
It may also be worth prioritizing presenters and vendors based near the venue, or choosing a venue near the companies and experts you plan to work with.
Where your technology ships from matters too. SmartSource’s strategically located facilities mean equipment travels shorter distances to the venue, which reduces freight miles and the emissions tied to them.
TALK WITH AN EVENT TECHNOLOGY PARTNER ABOUT EVENT SUSTAINABILITY OPTIONS
When it comes to identifying and tracking sustainability metrics, planning is critical. And planning includes bringing an event tech partner into the discussion.
Talk with a SmartSource event technology specialist about which sustainability metrics fit your next event. We’d be happy to share what other clients are doing in the sustainability space.
FREQUENTLY ASKED QUESTIONS ABOUT EVENT SUSTAINABILITY AND SUSTAINABILITY METRICS
Here are quick answers to common questions about event sustainability metrics.
What are the most important event sustainability metrics?
The most useful metrics to start with are waste diversion rate, reduction in printed materials compared with a past event, the number of printed signs replaced by digital signage, and the share of vendor spend with local suppliers. Many organizations also track carbon emissions per attendee, since attendee travel is often a major source of an event’s footprint.
How can event technology reduce event waste?
Event technology reduces waste by replacing single-use printed materials. Digital signage replaces printed banners and directional signs, an event app replaces printed programs and maps, and onsite kiosks print badges on demand, only for attendees who check in.
What if we never tracked event sustainability metrics before this year?
Even if you didn’t actively track your sustainability metrics before 2027, you can use your past event data to construct metrics for the year. For example, if you switch to digital signage, you can compare the number of printed signs and materials used at previous events to measure how much paper waste you’ve reduced.